景気のケーキ
電通総研の「消費マインド調査2016」という
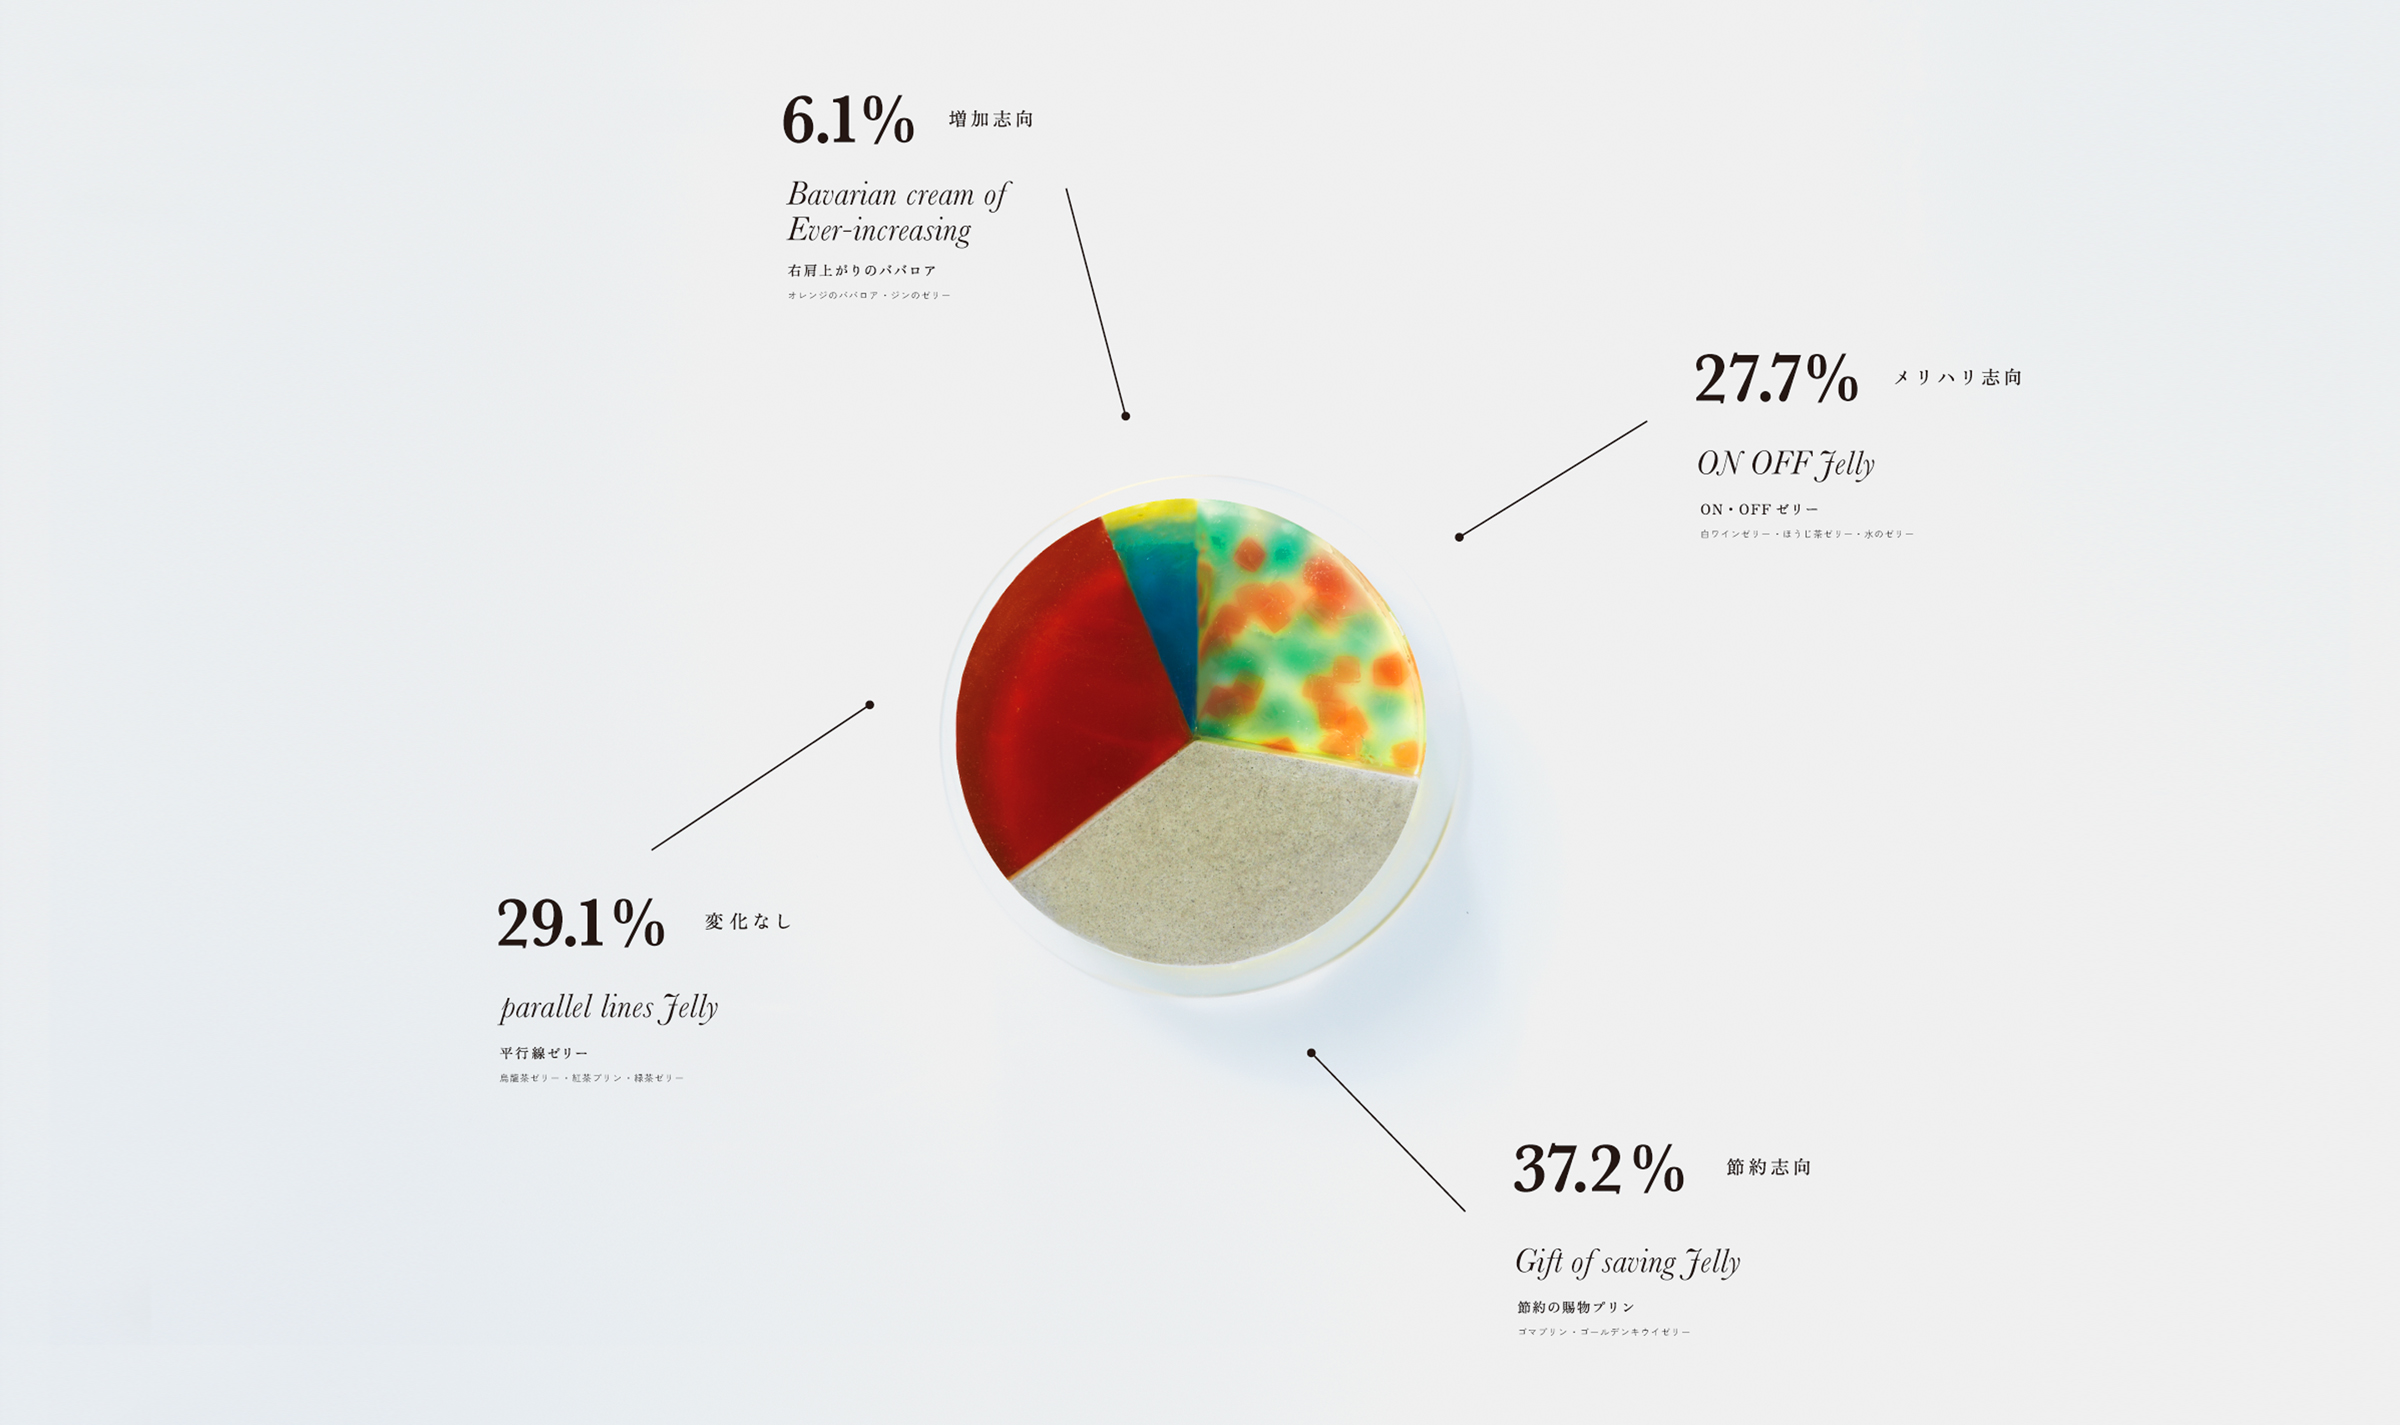
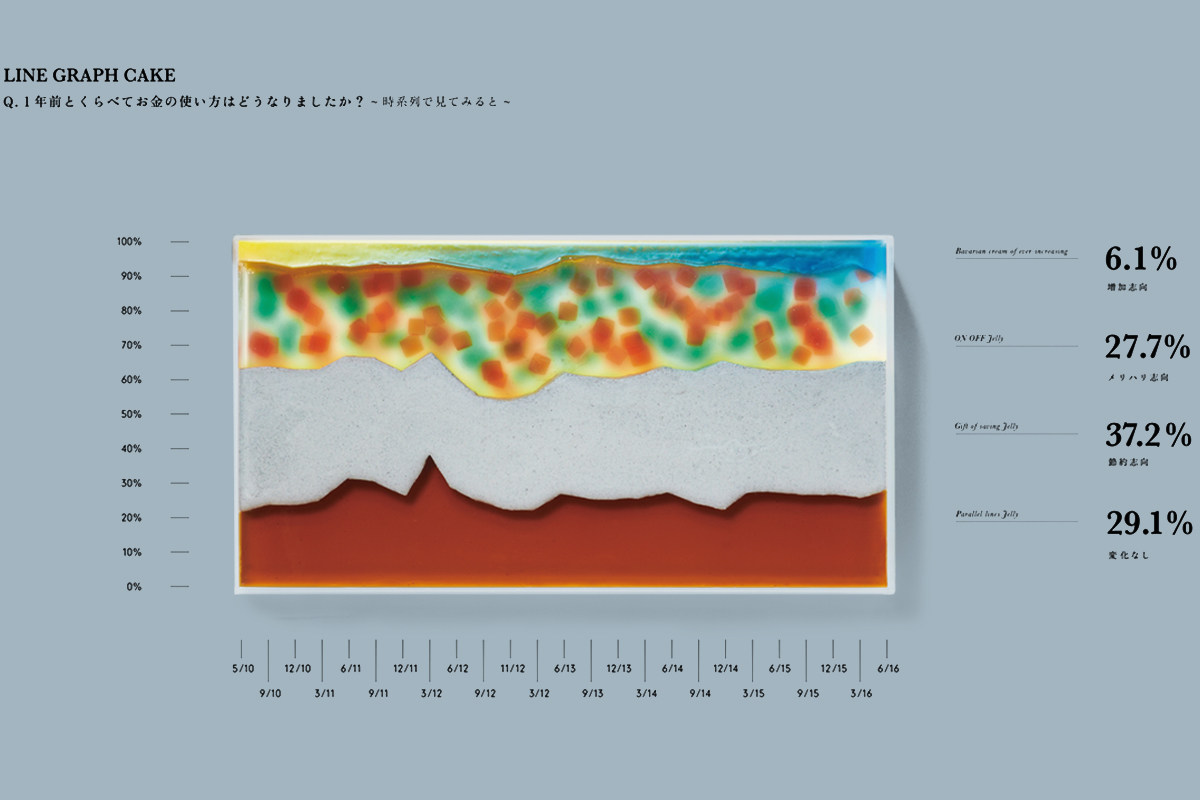
データをもとに制作した「景気のケーキ」
「一年前と比較してみるお金の使い方の変化について」
というデータを構成する
「節約志向」「メリハリ志向」
「上昇志向」「変化なし」
の各割合と内容を読み解き
お菓子へ落とし込みました
表現としては「Pie chart cake」(円グラフ)と
過去からの流れをみる「Line graph cake」(棒グラフ)の二種類
それぞれのケーキの味と視覚的構成に意味あり
電通総研DAYというイベントで振る舞われました
https://forbesjapan.com/articles/detail/17331/2/1/1
データをもとに制作した「景気のケーキ」
「一年前と比較してみるお金の使い方の変化について」
というデータを構成する
「節約志向」「メリハリ志向」
「上昇志向」「変化なし」
の各割合と内容を読み解き
お菓子へ落とし込みました
表現としては「Pie chart cake」(円グラフ)と
過去からの流れをみる「Line graph cake」(棒グラフ)の二種類
それぞれのケーキの味と視覚的構成に意味あり
電通総研DAYというイベントで振る舞われました
https://forbesjapan.com/articles/detail/17331/2/1/1
“Cakes of Economics” is based on a Consumer Confidence survey
conducted by Dentsu Communication Institute in 2016.
Data representing consumer spending habits
compared to last year includes:
- The budget minded
- Consumer spending on certain categories
- Overall increased spending
- No change in spending habits
Percentages and results are reflected in the taste,
shape and color of both the pie chart and bar graph cakes.
The cakes were served during an event
hosted by Dentsu Communication Institute.
Dentsu Innovation Institute Day
2016.7.26
